Greenland is rising – literally

A researcher is sitting in a boat with his computer

Researchers collaborate with Greenlandic fishermen, catchers, and schoolchildren to map how much the country rises.


By Uffe Wilken, Polarfronten 


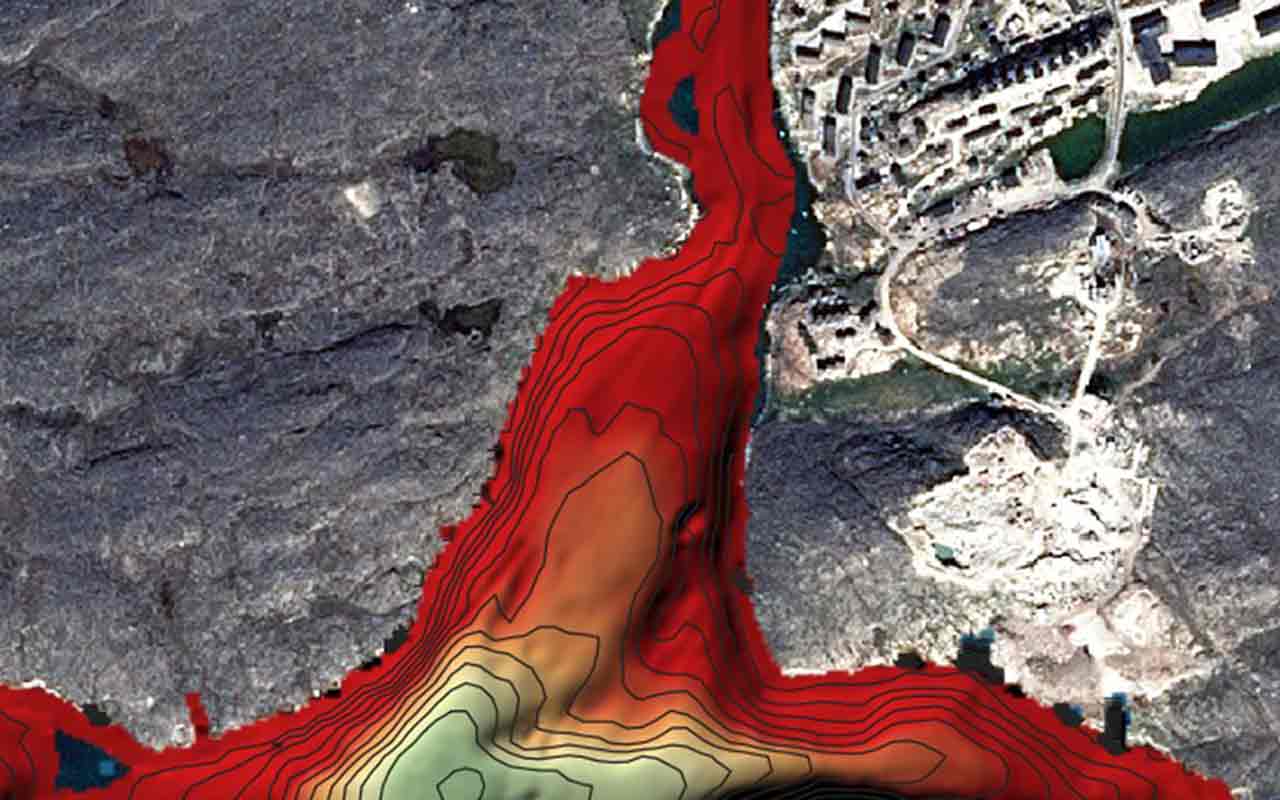
The statement Greenland rising must be taken literally because Greenland is rising, and the Greenland Rising project aims to measure and predict how much it will rise in the coming years. Although it is only about a few millimeters each year, it may have a significant impact on the sailing in the fjords and for construction projects like ports, quays, and drainage in the long run. In some places, the rising over the last few generations have already had consequences. Project coordinator Karl Zinglersen from Pinngortitaleriffik (Greenland Institute of Natural Resources) says:


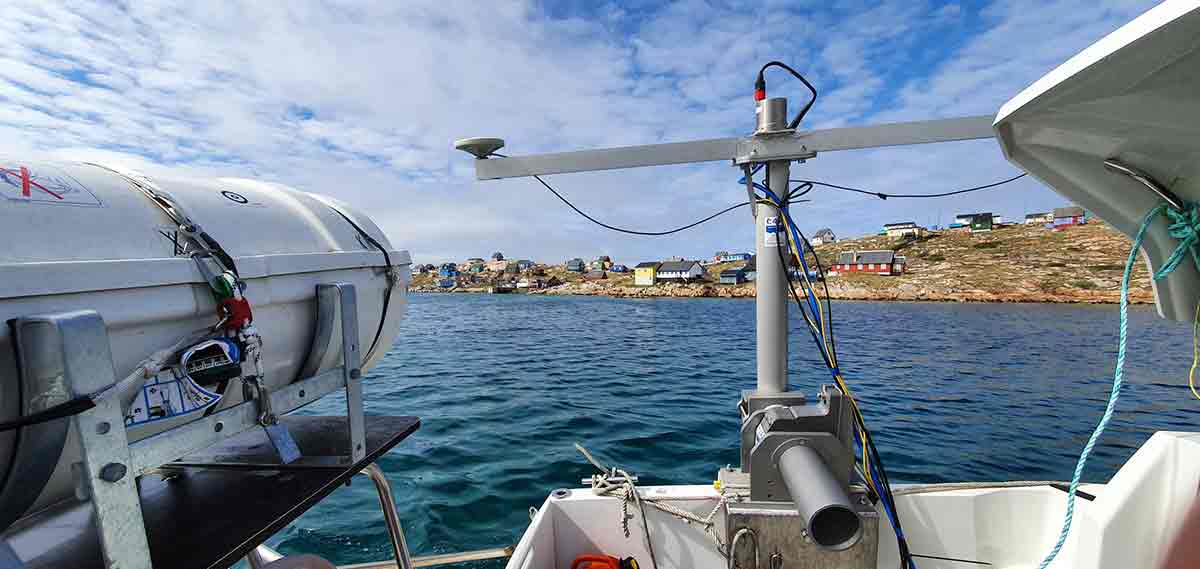
“When we’re out on field work, we get to talk with the locals. Some of the elders have experienced that they can no longer access certain areas where they used to be able to sail. But now some of the slopes are a bit higher, so the locals need to take another route than the one they used to take. We’ve heard several examples of this, and it’s interesting that the local population can see what we’re measuring here. It’s nice to know for us, because even though we’re talking millimeters, it matters over time.”


The ice is crucial  

Two things decide how much Greenland will rise. One is the melting of the ice sheet since the end of the last ice age roughly 10,000 years ago. Less ice means that the weight of the ice is no longer pushing down the land, and, thus, the land is going to rise. But since the ice is disappearing at different speeds in different parts of the country, the rise is not consistent.

The other thing is how ice attracts the sea. The ice is a large mass, and masses attract. A well-known example is the moon attracting water with tides being the result. The water flows with movements of the moon. If the ice is further away, the attraction will be reduced and in that case the water will move away. If the ice sheet is close to the sea, the attraction will be greater. But if the ice is close to the sea, and the ice is melting quickly, as is happening now, the weight is likewise removed quickly, forcing the land to rise rapidly. The result can be seen in, for example, Kullorsuaq. Here, the country is rising by roughly 10.5 millimeters a year, while the sea level will drop by 2.7 meters toward 2100. In Nuuk and Aasiaat the ice is further away, so there the attraction is minimal.


Besides Kullorsuaq, Greenland Rising is also investigating three other locations around Greenland: Nuuk, Aasiaat and Tasiilaq. Preliminary calculations up to the year 2100 show a somewhat varied picture where Nuuk is going to rise 3.3 mm a year and water levels drop by 0.6 meters. In Tasiilaq, the land will rise 7.7 mm a year while the water level will drop by 1.3 meters.


Different locations rise differently

The Greenland Rising project is joint project between Columbia University in New York and Pinngortitaleriffik in Nuuk. Karl Zinglersen explains:


“It’s about measuring what it looks like today and then modelling it out over the long term to see what will happen by 2100. We use up-to-date information from GNET, a group of high-precision GPS-stations across Greenland that is maintained by DTU Space. They measure the movement of the earth’s crust in all directions. The stations can measure how it rises 10 mm a year at one station, while at another it might only be 7 mm. As long as you have the stations, they will measure and show the variation over the years.”


The variations owe to the development of the Ice Sheet. For example, looking at Nuuk now and the last time the area was covered in ice, it has been more than 10,000 years. The land around Nuuk is rising 3 mm a year, while in Kullorsuaq in northwestern Greenland, close to the Ice Sheet and where the last ice age retreated more recently, the land is rising roughly 10 mm a year. The ice determines the changes. For Kullorsuaq it is 10 cm in 10 years and 80 cm by 2100.

Despite it being only a few millimeters a year, it becomes centimeters as time passes. That is also the reason why this project is engaged in dialogue with the Department of Infrastructure about port conditions. For example, if you want to make changes to the port in Aasiaat, it needs to be done in a particular way to avoid having to change the port again 50 years from now.


Children join Greenland Rising

In addition to collecting data from the GPS-stations, a part of the field work goes into measuring the seabed, talking to fishermen and catchers – and, not least, engaging schoolchildren in the work of establishing stations that can measure tides. Karl Zinglersen explains:


“In our school-project we inform the students that climate change is not only a global phenomenon, but also a local issue that means something to them. This includes water level rises and drops. We have two different types of stations – the expensive ones that we put up ourselves; but for learning purposes the students are in charge of putting up the simpler models. The students get to see a natural science method, as well as the practical aspect of setting it up and retrieving data from it.”


A side effect of Corona

Part of the researchers’ field work is to interview fishermen and catchers to involve the locals in the project. Karl Zinglersen says:


“We ask the fishermen how they view their local areas in relation to climate change, general changes and natural resources. And we specifically ask about geology; if they have noticed something that has risen compared to earlier. In addition, we receive data from areas outside of the ports and produce maps for the fishermen as a gesture so they can see their areas. We’ve hired a young geophysicist who was born and raised in Nuuk, and we’ve had Greenlandic students joining us so we could work while speaking Greenlandic.”

Karl Zinglersen tells about the field work and working closely with the locals:


“In April, we were in Kullorsuaq and out on the ice with a catcher fishing for halibut through a hole in the ice. The halibuts were few and small. So we noted the GPS-position and looked at the map from an earlier measurement. We suggested that the catcher moved a bit in one direction because then he would reach a hollow which might be better for catching halibuts. He did so and pulled up one big fish after another. It was nice to experience how our data could be used to help him. It is useful.”


Contact: Karl Zinglersen


Read more about Greenland Rising

This article is part of a theme issue of Polarfronten about Arctic Hub. The issue has been made as a collaboration between Arctic Hub and Polarfronten.

Photos
Top photo Inside the cabin of Aron Aqqalu Møller from Aasiaat. Aron Aqqalu steers the boat, while Aqqaluk Sørensen keeps track of the measurements. As a local, Aron Aqqalu has lifelong experience in navigating the waters to the great advantage of the surveys (from Pinngortitaleriffik’s Facebook page).
Photo 1 Measurements in the Ikerasannguaq Strait near Aasiaat. The red color means shallow depths, and green deeper waters – relatively speaking. The narrow strait can only be sailed with a dinghy and is only approximately 1 m deep at its northern mouth. (Measurement: Aqqaluk Sørensen. From Pinngortitaleriffik’s Facebook page).
Photo 2 Installation of multibeam equipment on a smaller cabin boat from Aasiaat. A large bracket is attached to the railing and holds a vertical rod in strong aluminum. In the water at the end of the vertical rod sits the multibeam sonar mounted, above a transverse rod with two high-precision GPS antennas. The bracket can be rotated so that the sonar can be taken up from the water during transport (from Pinngortitaleriffik’s Facebook page)
Photo 3 Survey of a sunken vessel located off Aasiaat. The lines each consist of 1024 points ”beams” which each hit a piece of the boat to form a three-dimensional delineation (from Pinngortitaleriffik’s Facebook page).